Market Information
![]()
Technical Thoughts – March 12, 2026
By: Ken Lake
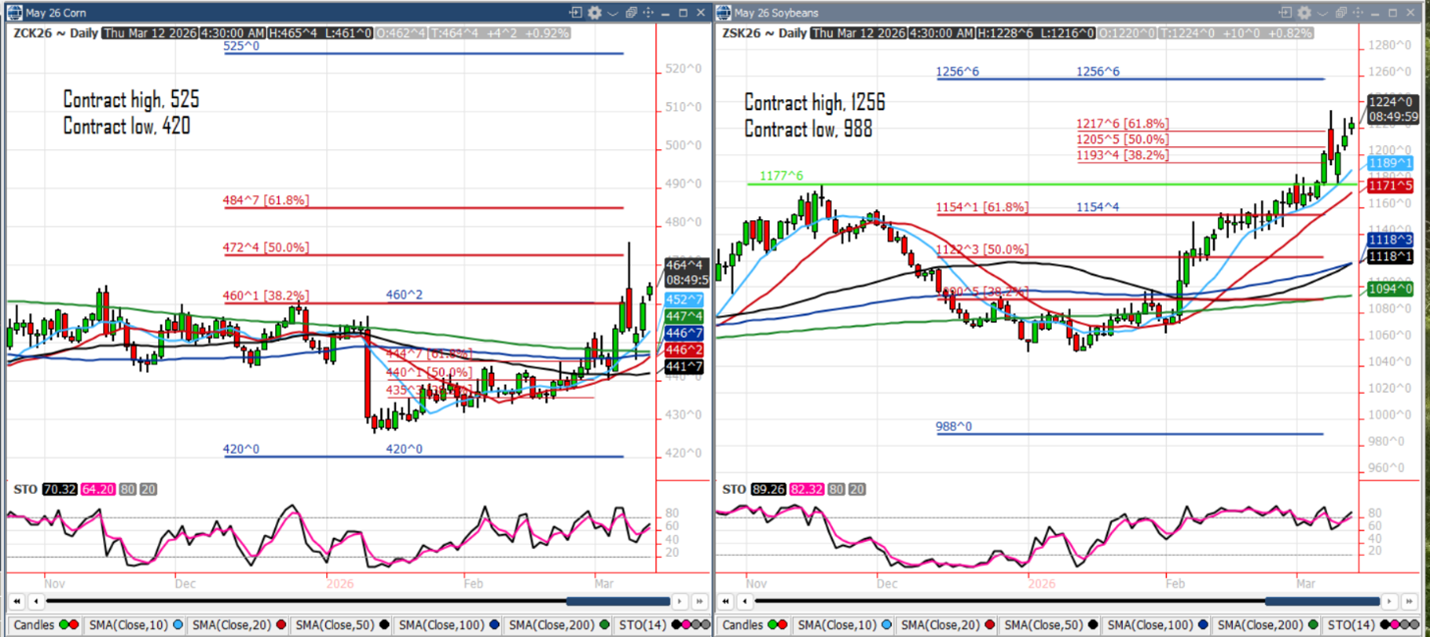
Both May corn and May soybeans have gapped higher for two consecutive sessions. Fibonacci resistance and the upside targets in the May corn contract are 472, 484, 525. Monday’s high at 476 for the corn and 1233 in the soybean contract may offer resistance as well. The sell stops are the 10-day moving averages in the contracts, 452 and 1189.
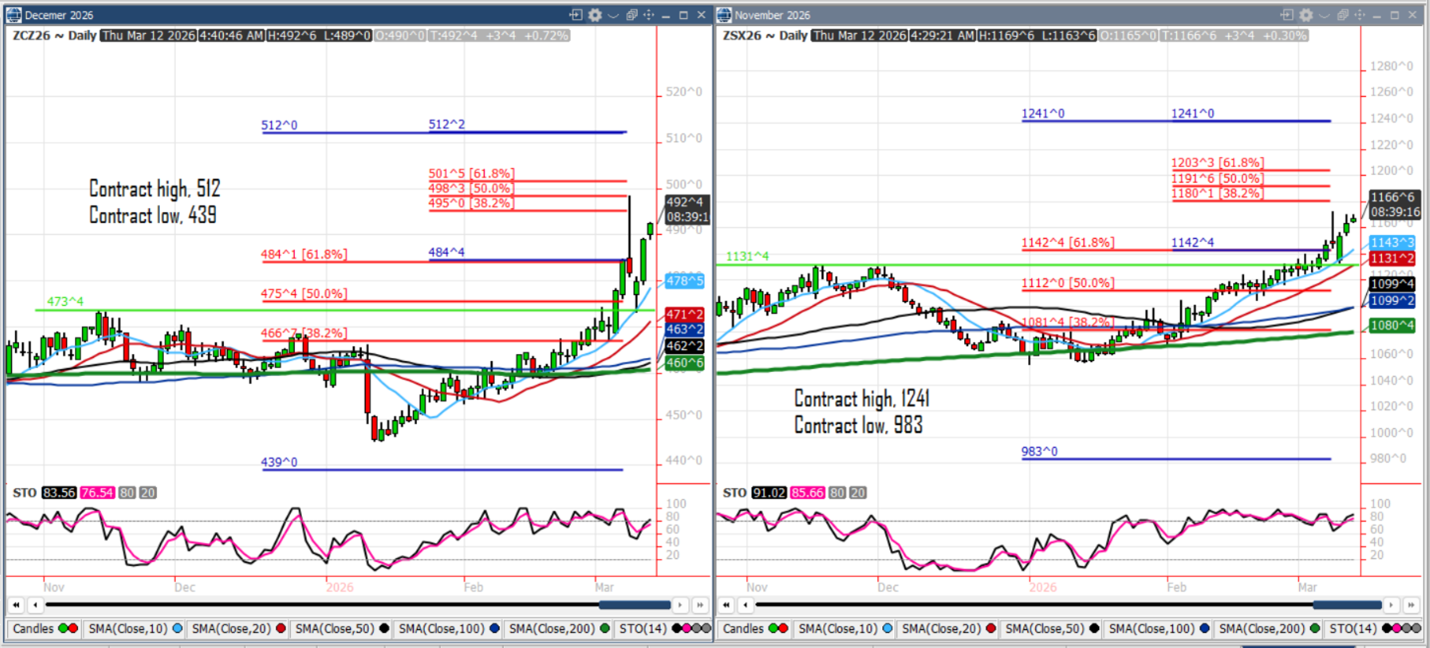
Likewise, both December corn and November soybeans have gapped higher for the past two sessions. This leaves our upside projections at 495, 498, 501, 512 in the corn contract intact and 1180, 1191, 1203, 1241 in the soybean contract. Monday’s highs at 498 in the corn and 1172 will offer some additional resistance.
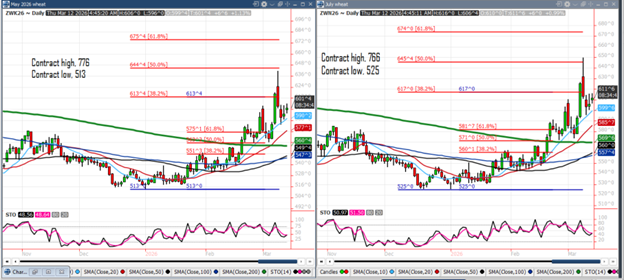
Wheat is being more of a follower here but is tracking the respective contract’s 10-day moving average higher. The upside targets in the May contract is 613, 644 and in the July contract is 617, 645.
Charts of the Day – March 12, 2026


Market Commentary – March 12, 2026
by: Chris Betz
| Corn | Soybean | Wheat | |||||||
| Old Crop (futures month, change, settle price) | CK6 | 2’2 | 462’4 | SK6 | 13’2 | 1227’2 | WK6 | 3’6 | 598’4 |
| New Crop (futures month, change, settle price) | CZ6 | 1’0 | 490’0 | SX6 | 4’2 | 1167’4 |
WN6 | 3’6 | 609’4 |