Market Information
![]()
Charts of the Day – July 21, 2026


Market Commentary – July 21, 2026
by: Chris Betz
| Corn | Soybean | Wheat | |||||||
| Old Crop (futures month, change, settle price) | CU6 | 3’2 | 452’6 | SQ6 | 6’4 | 1219’4 | WU6 | 4’0 | 678’0 |
| New Crop (futures month, change, settle price) | CZ6 | 2’2 | 475’2 | SX6 | 3’4 | 1222’6 |
WN7 | 6’2 | 717’4 |
Technical Thoughts – July 16, 2026
By: Ken Lake
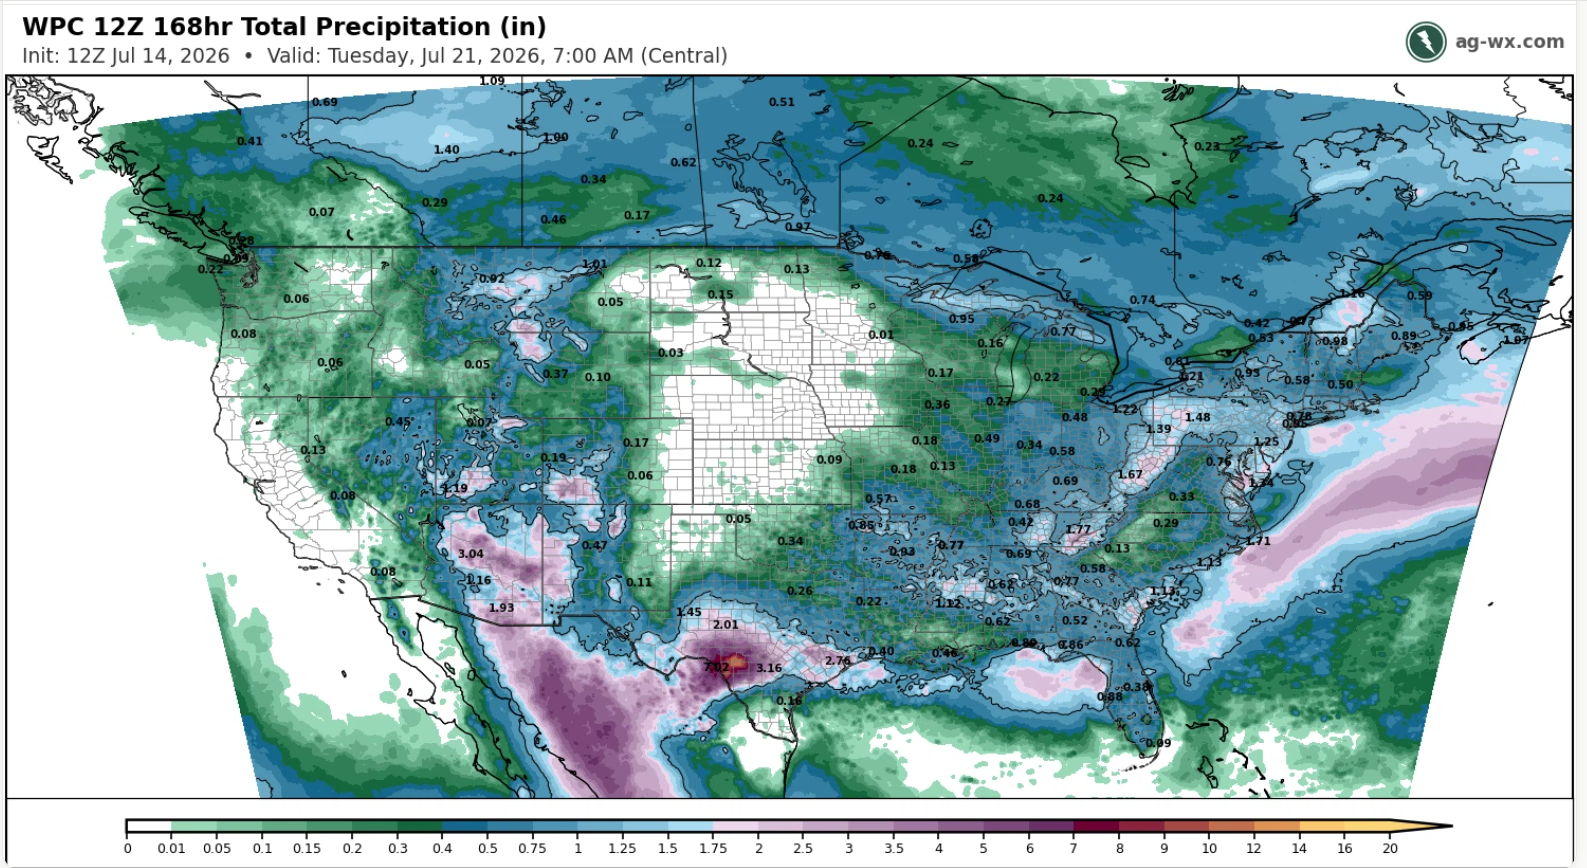
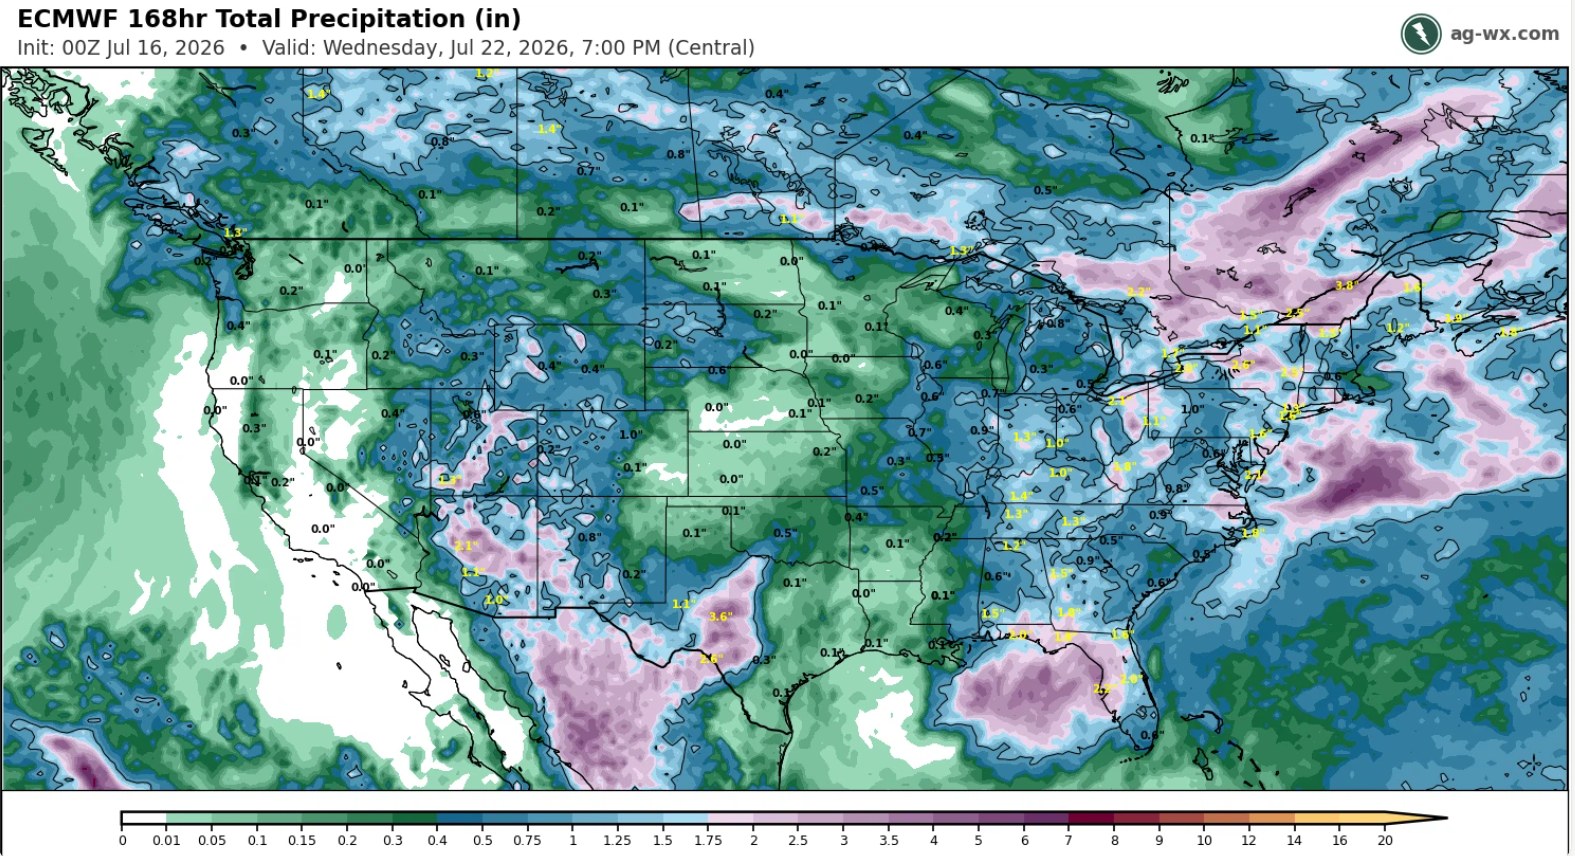
Much attention is now being focused on weather models. The two that get most attention are the WPC from the National Weather Service (US) and the European Center for Medium Weather Forecasts (ECMWF). Currently, they both agree that the Eastern Corn Belt sees some relief by Tuesday leaving the Dakotas, Nebraska, Kansas needing more. We will be watching for a change in these models and will be most important to see an extension of the current pattern into next week in order to see further upside potential.
The WPC (National Weather Service) 7-day precip forecast continues to fill moisture in to the Eastern Corn Belt albeit simply “crop-saving” amounts and leaves the Dakotas, Nebraska, Kansas wanting.
The European model agrees with the WPC regarding the western corn belt but extends dryness into Oklahoma, Texas.
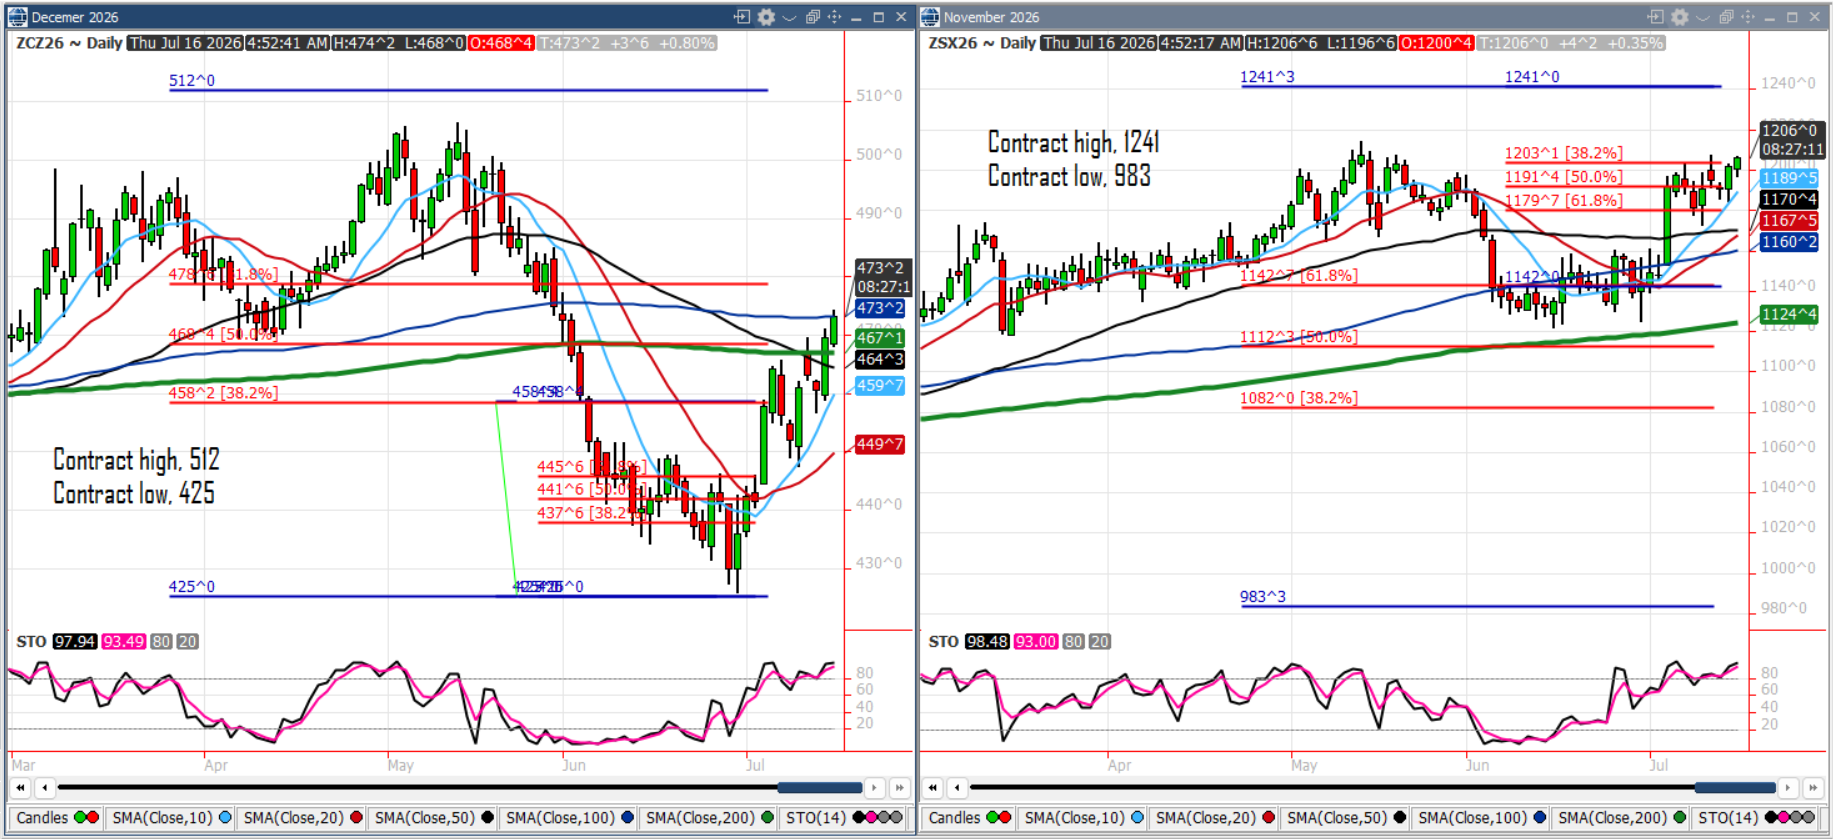
September corn dropped to test 10-day moving average support, now at 438, yesterday and recovered to close over 50-day moving average resistance, now 445. Overnight, the contract tested 200-day moving average resistance at 452. A close over 452 is needed in order to advance.
August soybeans continue to trade near 1200 and is looking for a fundamental boost in order to advance. the upside targets remain 1212, 1249.
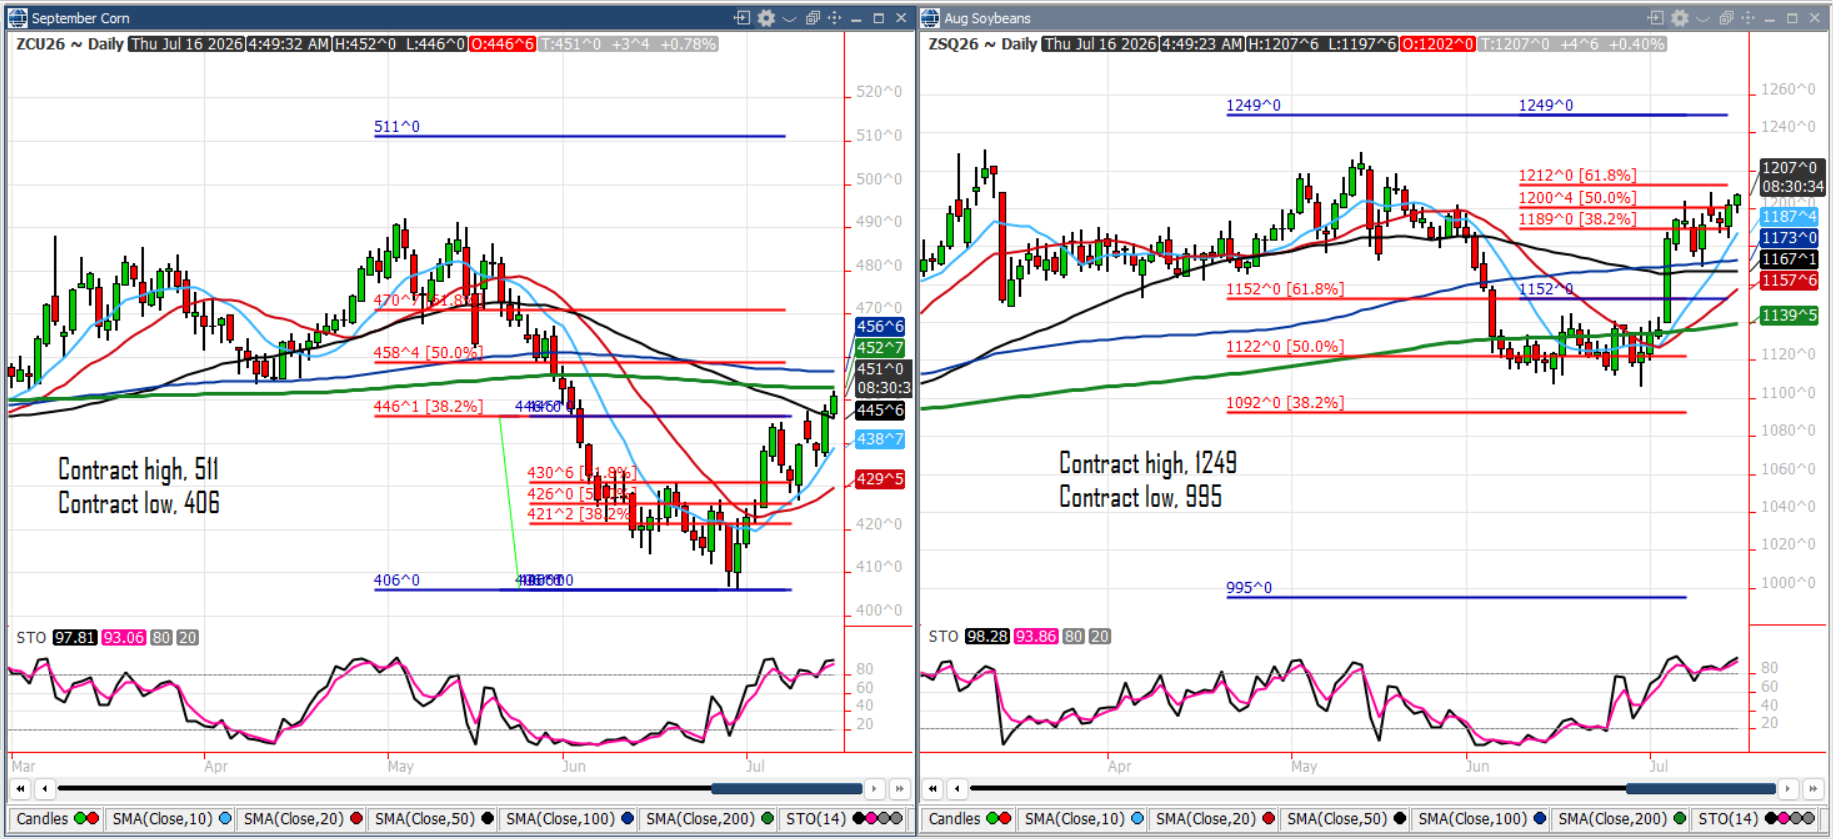
December corn achieved an important technical development yesterday closing above its 200-day moving average for the first time since June 1st. This move achieved the first of our current sales target at 468. 468 also marks a 50% retracement of the contract’s lifetime high to low. The next upside target is 478. I know it tough to make sales during adverse weather conditions but they usually turn out to result in some of the best sales of the year. Farmers should advance sales here.
November soybeans achieved another one of our upside targets at 1203 overnight. The life of contract high at 1241 is the next target. Advance sales here.
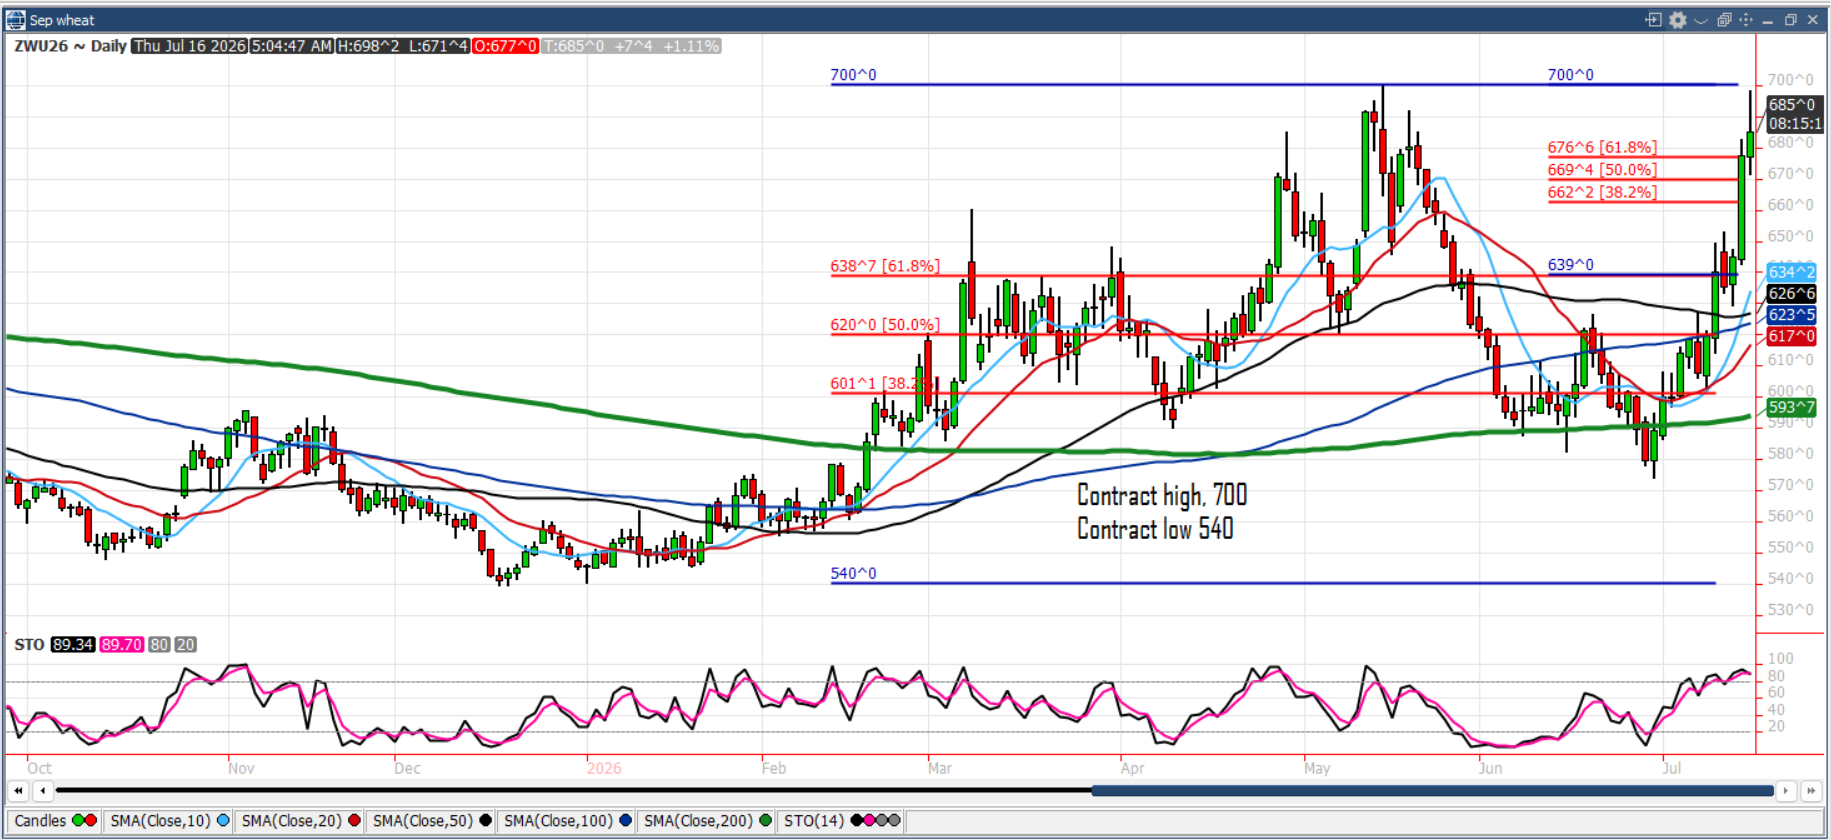
September wheat has traded to within 2 cents of its life of contract high at 700 overnight. Advance sales.