Market Information
![]()
Charts of the Day – April 26, 2024


Market Commentary – April 26, 2024
by: Chris Betz
| Corn | Soybean | Wheat | |||||||
| Old Crop (futures month, change, settle price) | CK4 | 1’0 | 440’0 | SK4 | 3’2 | 1159’4 | WK4 | 1’0 | 603’2 |
| New Crop (futures month, change, settle price) | CZ4 | 2’6 | 473’4 | SX4 | 0’6 | 1174’6 | WN4 | 1’6 | 622’2 |
Technical Thoughts – April 25, 2024
By: Ken Lake
Leading with the leader, wheat, now on a 5-day winning streak that began with Russian weather concerns and dryness in the Southwest US HRW area accelerated yesterday on freeze concerns over most of the winter wheat growing area in the US. This is the classic weather-related rally that we counted on each year over the decades but has taken a back seat in the last decade as ample wheat supplies allowed end users to simply wait until harvest to secure their supply. March/April freeze scares are selling opportunities.
This rally is impressive as during each session, any weakness have been met with buying and buoying price over the contract’s upside standard deviation value during each of the last four sessions with continued follow-through strength overnight.
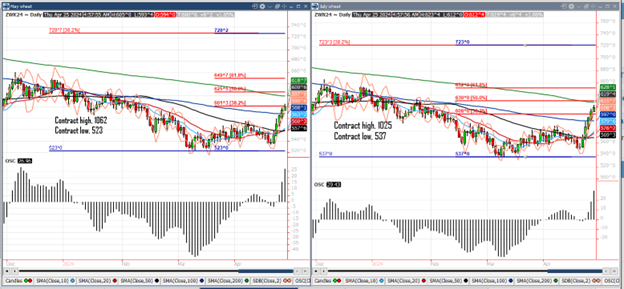
I have included both May and July charts below, but spot bids will move to the July contract by early next week. The only caution I have for old crop holders considering sales is that with the May:July spread, now 18 cents carry to the July, you may expect some basis improvement when cash bids get moved to the July. Additionally, that wide of carry to the new crop month tells you that the market is not concerns about the wheat supply supporting the notion that producers should be pricing both old and new crop wheat on this rally.
The upside target at 608 was achieved yesterday. Upside targets at 630, 652 are in play. Resistance is 628, the 200-day moving average. Sell stops should move up to 608.
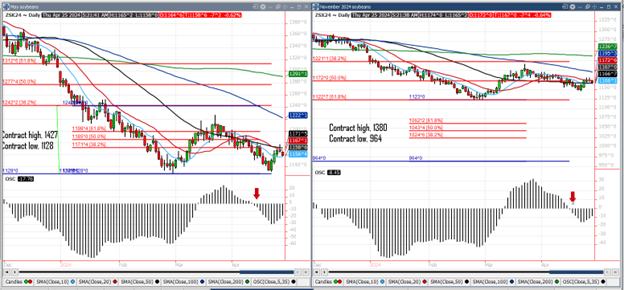
May soybeans made a high yesterday at 1177 with the 50-day moving average at that time, 1172. The contract then broke lower and made a disappointing close at 1166 below the 50-dma. This morning the contract has moved to 1158, just 2 cents above 10-day moving average support at 1156. A break of 1156 points to testing the life of contract low at 1128. The momentum oscillator remains in bearish territory. Sell stops should be 1156, 1128.
November soybeans continue to trade around its important Fibonacci value at 1172. One must remember, any trade over 1172 represents a trade in the top 50% of the life of contract range. This number should be protected. A break in weather accelerating planting progress will be a bearish weight on soybeans (and corn). If a producer decides to not make sales here, he must resign himself to waiting to see what June July weather brings.
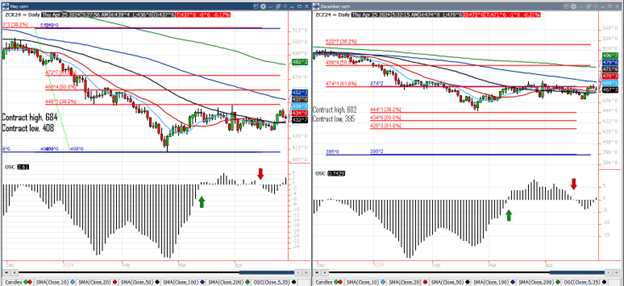
May corn made a high yesterday at 444 just under our target at 448 and now looks to test support at 432. 448 remains in play but a close under 432 signals a move back toward the life of contract low at 408.
December corn cannot gain momentum over 474. Moving average support values have consolidated between 467/470. A break of this consolidation offers risk to trade to Fibonacci support at 444. The momentum oscillator did move into a more positive stance but the 467/470 support zone must hold in order to advance values.
Fertilizer Update – April 15, 2024
By: John Ezinga
The situation in the Middle East have the markets a little choppy.
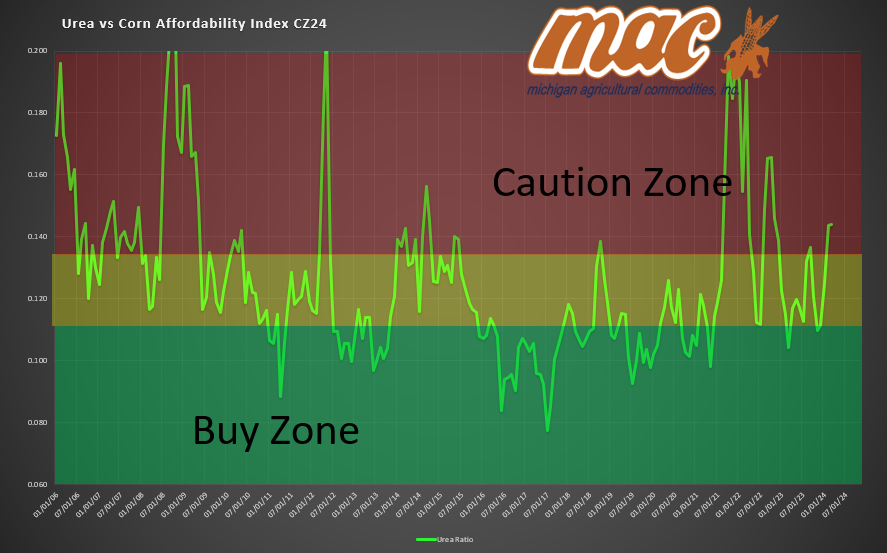
Urea is looking for a floor and if you have followed the charts lately you can see it was due a correction.
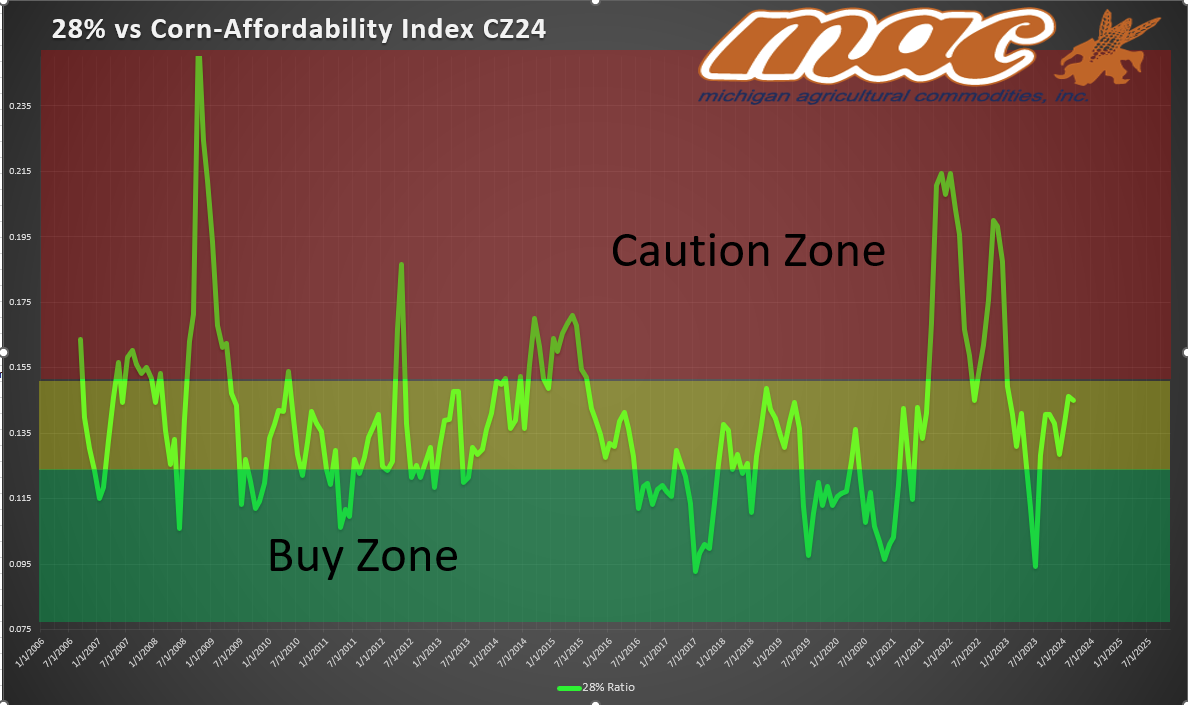
See below….urea was in the red last week and 28% was in the neutral zone. They usually run together so having urea come down makes sense.
AMS is finding more demand every year. Sulfur is a key component that does not come free in the rain anymore.
I think we could see a large shift in acres if the weather is not good for corn planting. Economics favor soy plantings so if planting conditions waver at all the shift will be ON!